Team Kauri won 9 of 12 games and scored 248 points. Team Rimu won 8 of 10 games and scored 219 points. Raw win totals and win rates tell slightly different stories, so both need to be considered.
Fluency check: read the source aloud once at a natural pace, pausing where the punctuation tells you to.TERM 1 · WEEK 7
Sports Stats
Hauora
0 / 7 missions complete

ENGLISH
Homophone Match-Up
01 · WorkshopLet’s investigate the words for Sports Stats. Look for what changes, then explain what you notice.
WHAT AM I LEARNING?
I can choose precise words and explain how shades of meaning change a message.
YOUR MISSION
Which word is most precise for a team that won 9 of 10 games?
TEACH · LEARN THE IDEA
Writers choose words for precision. Near-synonyms are not always interchangeable: each can suggest a different strength, attitude or level of certainty.
- STEP 1Read or tap each word.
- STEP 2Look closely at the word part the mission is teaching.
- STEP 3Sort, build or compare the words.
- STEP 4Explain the pattern in your own words.
PRACTISE · Try the words
Tap words to collect and compare them.
YEAR 5 DEEP DIVE · REQUIRED Complete this deeper Year 5 mahi as part of the mission — not as an optional extra.
Do the main mission first, then complete this section. It is deliberately more independent than Year 4 and is part of your weekly homework workload.
CHECK THE CORE IDEA
Which word is most precise for a team that won 9 of 10 games?

ENGLISH
Comparing Details & Finding Evidence
02 · LibraryRead the Sports Stats information first. Talk the idea through, then answer one small question at a time.
WHAT AM I LEARNING?
I can read data displays and explain what the evidence does and does not show.
YOUR MISSION
Which team has the higher win percentage?
TEACH · LEARN THE IDEA
Graphs and tables show patterns, comparisons and variation. Always read the title, units, labels and scale before drawing a conclusion.
- STEP 1Read once to understand what it is mostly about.
- STEP 2Read the question again and find the part that helps.
- STEP 3Say your answer aloud using because, then check it against the text.
- STEP 4Record a useful clue from the source.
- STEP 5Explain what that clue tells you.
TEACH · Read this first
Team Kauri won 9 of 12 games and scored 248 points. Team Rimu won 8 of 10 games and scored 219 points. Raw win totals and win rates tell slightly different stories, so both need to be considered.
CHECK THE TEXT · Find a clue
A clue from the text is called evidence.
YEAR 5 DEEP DIVE · REQUIRED Complete this deeper Year 5 mahi as part of the mission — not as an optional extra.
Do the main mission first, then complete this section. It is deliberately more independent than Year 4 and is part of your weekly homework workload.
CHECK THE CORE IDEA
Which team has the higher win percentage?

ENGLISH
Writing a Sports Recap
03 · Creative StudioYOUR WRITING JOB: Write a sports recap that uses at least two statistics and explains what they show rather than simply listing them.
WHAT AM I LEARNING?
I can write an informative report that groups related ideas and uses evidence.
YOUR MISSION
Write a sports recap that uses at least two statistics and explains what they show rather than simply listing them.
TEACH · LEARN THE IDEA
Reports use a clear focus, grouped information and accurate vocabulary. Select evidence that supports the purpose and avoid irrelevant detail.
- STEP 1Introduce what you are writing about.
- STEP 2Give your first important idea.
- STEP 3Add another useful detail, reason or example.
- STEP 4Finish so the reader understands your message.
NEED TO GET YOUR IDEAS READY?
Choose any way that helps. These are optional — you can always do the whole mission on screen.
ON SCREEN — use the planning boxes below.PEN & PAPER — if you want to, draw or jot your ideas first.SAY IT OUT LOUD — explain your idea to yourself before writing.TALK IT THROUGH — if someone is available, you can talk with a friend, sibling, whānau member or adult.
PRACTISE · Plan it one step at a time
SELF-CHECK · Check your work
This checklist helps you check your work. You do not have to tick every box to submit — the mission check looks at the work you created.
YEAR 5 DEEP DIVE · REQUIRED Complete this deeper Year 5 mahi as part of the mission — not as an optional extra.
Do the main mission first, then complete this section. It is deliberately more independent than Year 4 and is part of your weekly homework workload.
YOU TRY
Write a sports recap that uses at least two statistics and explains what they show rather than simply listing them.
Minimum guide: 90 words. Quality matters: make the reasoning, evidence or design decision clear. □ answers the exact task□ uses specific detail□ ideas are connected□ reread and improved

MATHS
Comparing Fractions & Tenths
04 · Maths LabWork through one maths question at a time. Your answers will be checked before the next mission unlocks.
WHAT AM I LEARNING?
I can compare and connect fractions, decimals and percentages in familiar contexts.
YOUR MISSION
1) 9/12 as a percentage 2) 8/10 as a decimal
TEACH · LEARN THE IDEA
Fractions, decimals and percentages are different representations of the same quantity. Use benchmark values such as 0, 1/2 and 1 to compare.
- STEP 1Read the question and decide what you need to find.
- STEP 2Notice the important numbers and units.
- STEP 3Choose a strategy and work it out.
- STEP 4Type the answer, then check that it makes sense.
PRACTISE & SOLVE · One question at a time
Read → choose a strategy → work it out → check your answer. Correct answers stay correct if another question needs another go.
YEAR 5 DEEP DIVE · REQUIRED Complete this deeper Year 5 mahi as part of the mission — not as an optional extra.
Do the main mission first, then complete this section. It is deliberately more independent than Year 4 and is part of your weekly homework workload.
CORE YEAR 5 QUESTIONS
MATHS
Comparing Success Rates
05 · Mission DeckThis is your real-world Sports Stats challenge. Work out what the problem asks you to find or make.
WHAT AM I LEARNING?
I can use evidence to recommend an action.
YOUR MISSION
Compare the two teams fairly. Use win rate plus one other statistic and explain which evidence matters most.
TEACH · LEARN THE IDEA
A recommendation should link evidence to a decision. State the evidence, explain what it means, then justify the action you propose.
- STEP 1Read the whole challenge once.
- STEP 2Find the numbers, facts or rules you need.
- STEP 3Choose a useful strategy.
- STEP 4Show your solution clearly enough that someone else could follow it.
CREATE · What do I need to solve?
Compare the two teams fairly. Use win rate plus one other statistic and explain which evidence matters most.
Choose a way to show your thinking. There can be more than one good strategy.
Ways to think away from the screen
PEN & PAPER — show your working there if it helps.
SAY IT OUT LOUD — explain what you need to find.
TALK IT THROUGH — if someone is available, you can discuss your strategy.
YEAR 5 DEEP DIVE · REQUIRED Complete this deeper Year 5 mahi as part of the mission — not as an optional extra.
Do the main mission first, then complete this section. It is deliberately more independent than Year 4 and is part of your weekly homework workload.
YOU TRY
Compare the two teams fairly. Use win rate plus one other statistic and explain which evidence matters most.
Minimum guide: 60 words. Quality matters: make the reasoning, evidence or design decision clear. □ answers the exact task□ uses specific detail□ ideas are connected□ reread and improved
MATHS
Beat the Buzzer
06 · ArcadeGAME BREAK
Play the challenge and follow the instructions inside the game. Complete at least one challenge successfully to finish this Game Break.
ICONIC ARCADE · TERM 1 · WEEK 7
Treasure Hunt
Single-player · touch friendly · progress saves on this deviceFind the three coordinates in order to open the chest.
CLUES FOUND 0 / 3 YEAR 5 DEEP DIVE · REQUIRED Finish the game, then prove the learning in the final rounds.
Do the main mission first, then complete this section. It is deliberately more independent than Year 4 and is part of your weekly homework workload.
YEAR 5 GAME CHECK
Finish the game first, then use the learning from this week to clear these three final rounds.
How did Week 7 feel?
07 · ClubhouseThis part is about your own learning. There are no right or wrong feelings.
WHAT AM I LEARNING?
Reflect on independence, challenge level and the next useful Year 5 practice step.
YOUR MISSION
What is one way percentages helped you compare more fairly than raw totals?
TEACH · LEARN THE IDEA
Choose what feels true for you, then write one thing you understand better now.
- STEP 1Choose how the week felt.
- STEP 2Write one thing you understand better now.
How did this week feel?
There are no right or wrong answers. Choose what feels true for you.
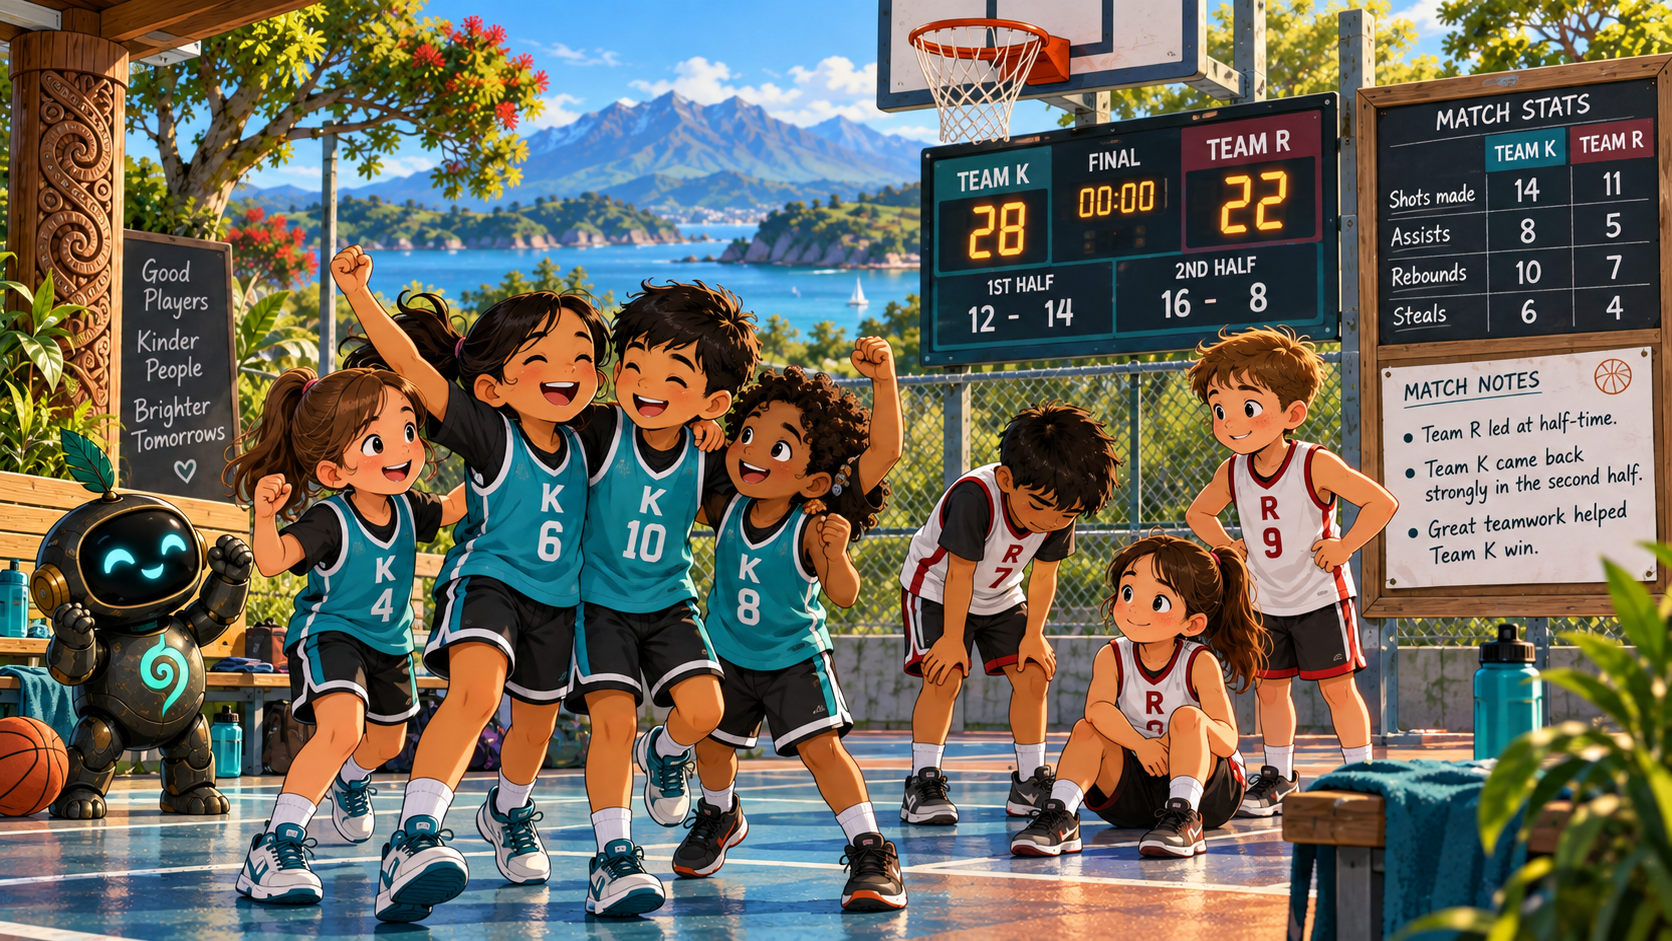
WHAT AM I GOING TO DO?
Write like a sports reporter
Look closely at the basketball image above. It gives you the result, half-time scores, match statistics and notes you need for your writing.
YOUR MISSION
Write two paragraphs recapping the match. Include at least three statistics from the reference image and one supported opinion.
PRACTISE · Plan it one step at a time
SELF-CHECK · Check your work
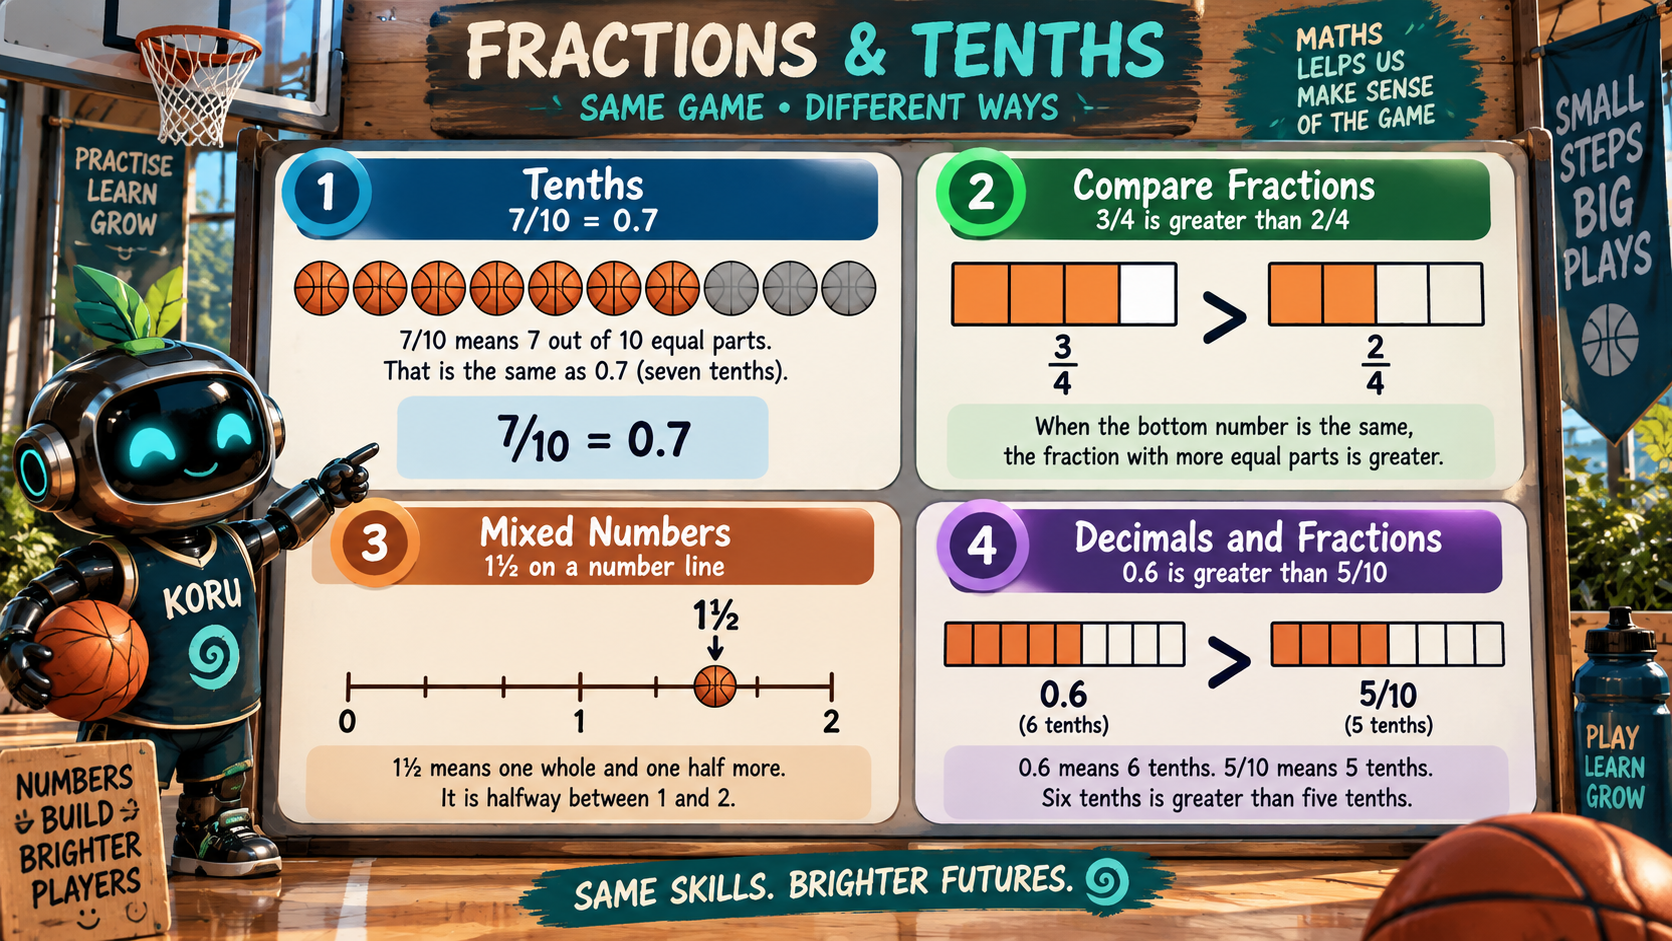
LEARN FIRST · SEE IT, THEN TRY IT
Fractions and decimals can show the same amount
A fraction shows equal parts of a whole. The bottom number tells how many equal parts make the whole, and the top number tells how many of those parts we have.
Tenths
If a whole is split into 10 equal parts, each part is one tenth. So 7/10 means seven tenths, and we can also write it as 0.7.
Compare fractions
When the bottom numbers are the same, the pieces are the same size. Compare the top numbers: 3/4 is greater than 2/4 because 3 pieces are more than 2.
Mixed numbers
1½ means one whole and another half. On a number line it sits halfway between 1 and 2.
Decimals and fractions
0.6 means six tenths. 5/10 means five tenths. Six tenths is greater than five tenths.
YOUR MISSION
Complete four basketball maths challenges. Use the reference image and the models below. You will see one challenge at a time, and a correct answer unlocks the next one.
YOUR SCORE0 / 4 challenges complete
CHALLENGE 1
Build seven tenths
Tap basketballs until 7 out of 10 are selected. Then choose the decimal that means the same amount.
0/10 selected
CHALLENGE 2
Which fraction is greater?
Both bars are split into four equal parts. Tap the fraction that shows the greater amount.
or
CHALLENGE 3
Find 1½ on the number line
1½ means one whole and one half more. Tap the point where 1½ belongs.
CHALLENGE 4
Compare tenths
Look at the two ten-part models. Which amount is greater?
?
🏀 4 / 4 · Ka pai!You used visual models to compare fractions, tenths and decimals.
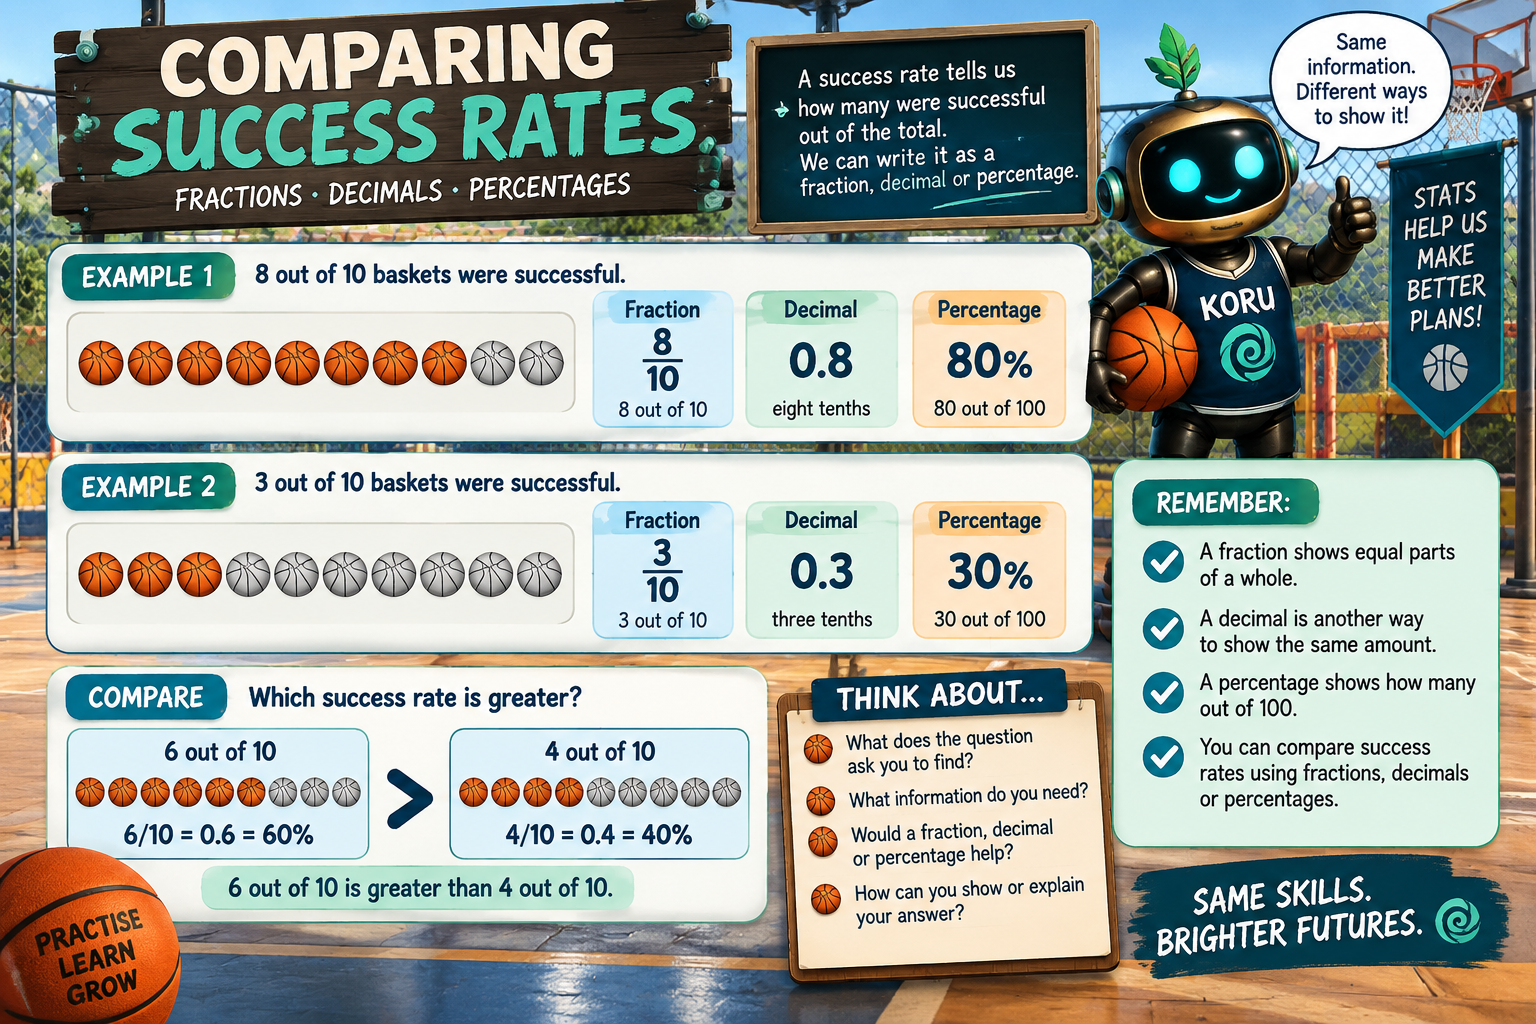
LEARN FIRST · SAME INFORMATION, DIFFERENT WAYS
What is a success rate?
A success rate tells us how many attempts were successful out of the total number of attempts. When the total is 10, the fraction and decimal both show tenths.
Player A: 8 out of 10
8/10 = 0.8. Both mean eight tenths.
Player B: 6 out of 10
6/10 = 0.6. Both mean six tenths.
Compare the tenths
Eight tenths is greater than six tenths, so 0.8 is greater than 0.6.
YOUR MISSION
Show each player’s success rate as a fraction and a decimal, then decide who has the greater success rate.
YOUR SCORE0 / 3 challenges complete
CHALLENGE 1
Player A makes 8 out of 10 shots
Choose the fraction and decimal that both show this success rate.
Fraction
Decimal
CHALLENGE 2
Player B makes 6 out of 10 shots
Choose the fraction and decimal that both show this success rate.
Fraction
Decimal
CHALLENGE 3
Who has the greater success rate?
VS
Now choose the best reason.
🏀 3 / 3 · Ka pai!You represented and compared success rates using fractions and decimals.
GAME BREAK · BASKETBALL ARCADE
🏀 Beat the Buzzer
Take 10 shots. Watch the timing marker and tap SHOOT when it reaches the green scoring zone. Score at least 5 baskets to beat the challenge.
SHOTS0 / 10BASKETS0STREAK0
Ready?
TIME YOUR SHOTTap when the marker is inside the green zone.
BEST: 0/10Get ready for your first shot.
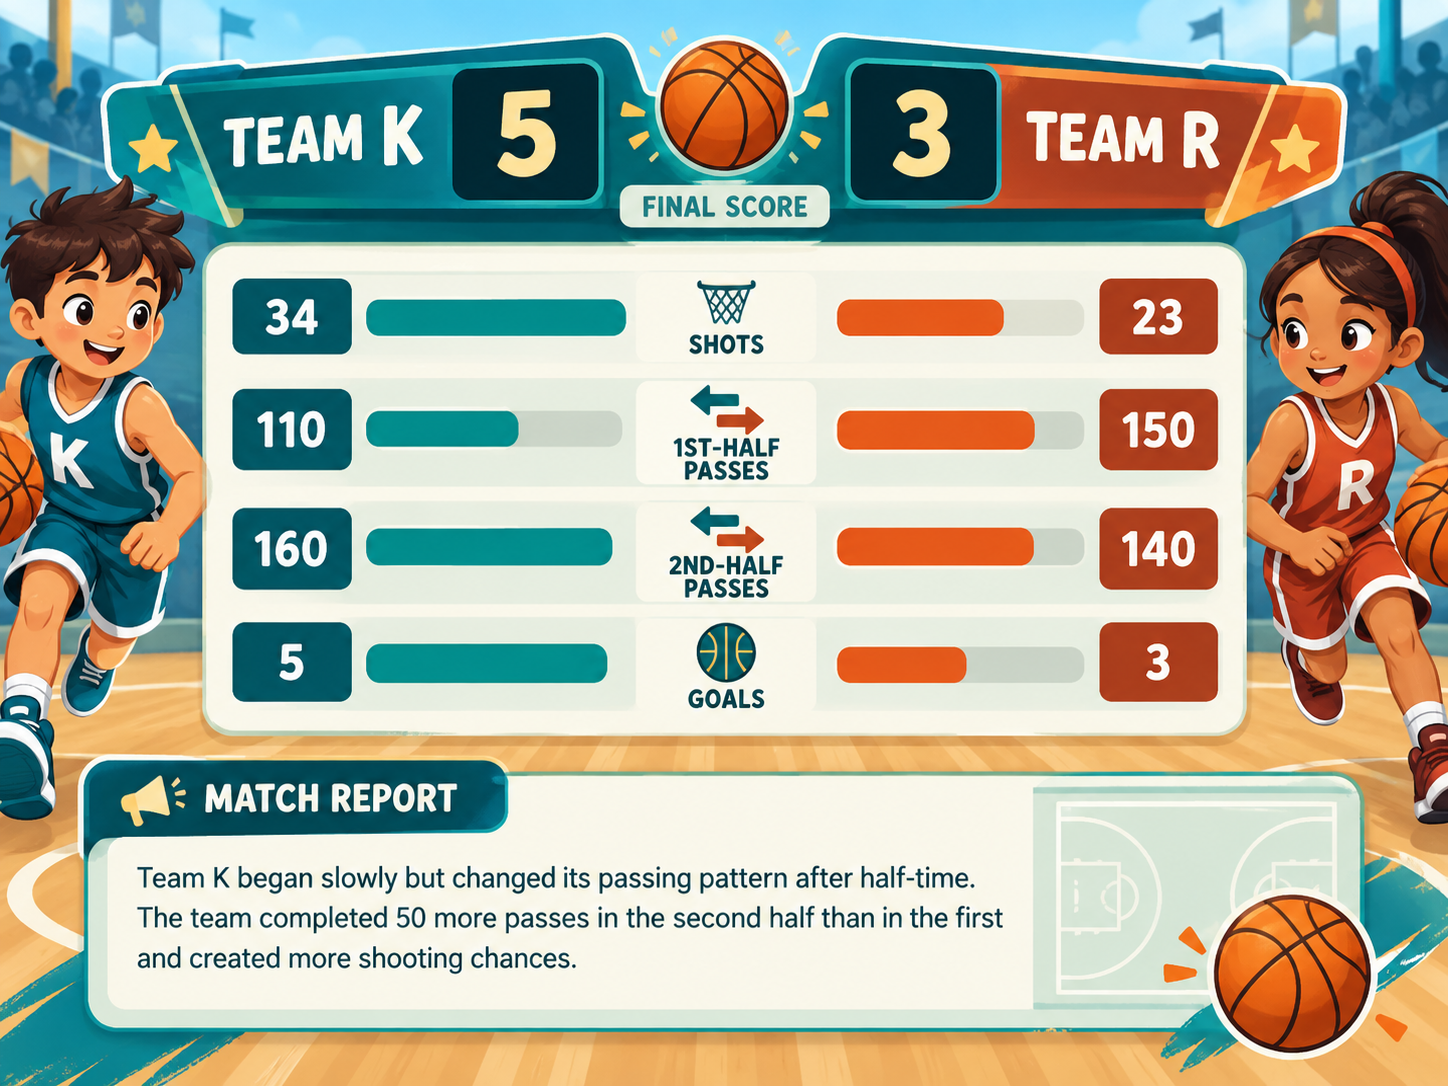
READ THE SOURCE · MATCH STATISTICS
Look closely at the match statistics.
Use the numbers in the image as your source. You will compare the two teams and choose the evidence that proves each answer.
LEARN FIRST · COMPARE AND PROVE
COMPARELook at the same statistic for both teams and decide which is more, less, greater or fewer.
FIND THE DIFFERENCESubtract the smaller number from the larger number to find how many more or fewer.
EVIDENCEEvidence is the exact number or fact from the source that proves your answer.
COMPARE THE DETAILS · FIND THE EVIDENCE
Answer one question at a time.
0 / 8 correct
Look back at the statistics whenever you need to. A correct answer stays locked in and the next question appears.
Which team made more second-half passes?
How many more second-half passes did Team K make than Team R?
Which team made more first-half passes?
How many first-half passes did Team R make?
Which team had the most shots?
Which team had the fewest goals?
Which evidence best shows that Team K improved its passing after half-time?
How many more passes did Team K make in the second half than in the first half?